APDB: Database of Air Pollutants
Documentation
APDB: a database on air pollutants characterization and similarity prediction
APDB is an essential resource which improves our knowledge on the existing air pollutants, their molecular properties and mechanisms of action. This database contains a collection of pollutant molecules mainly from online resources provided by the Environmental Protection Agency (EPA):
In APDB, air pollutants are chemically annotated and their activity in relation to the inhibition or activation of specific protein targets is reported.
Annotation is accomplished through PubChem identifiers such as PubChem Compound Identification (CID),
CAS, InChIKey, canonical SMILES and molecular formula. Activity is retrieved by listing associated targets and bioassays found in the
PubChem BioAssay repository. Molecules are characterized through molecular fingerprints
and descriptors calculated with PaDEL-Descriptor software and quantum-mechanical
properties computed with the quantum chemistry program Jaguar.
Similar molecules are derived from molecular descriptors and properties by applying the most common similarity measures after accurate data preprocessing.
Home Page
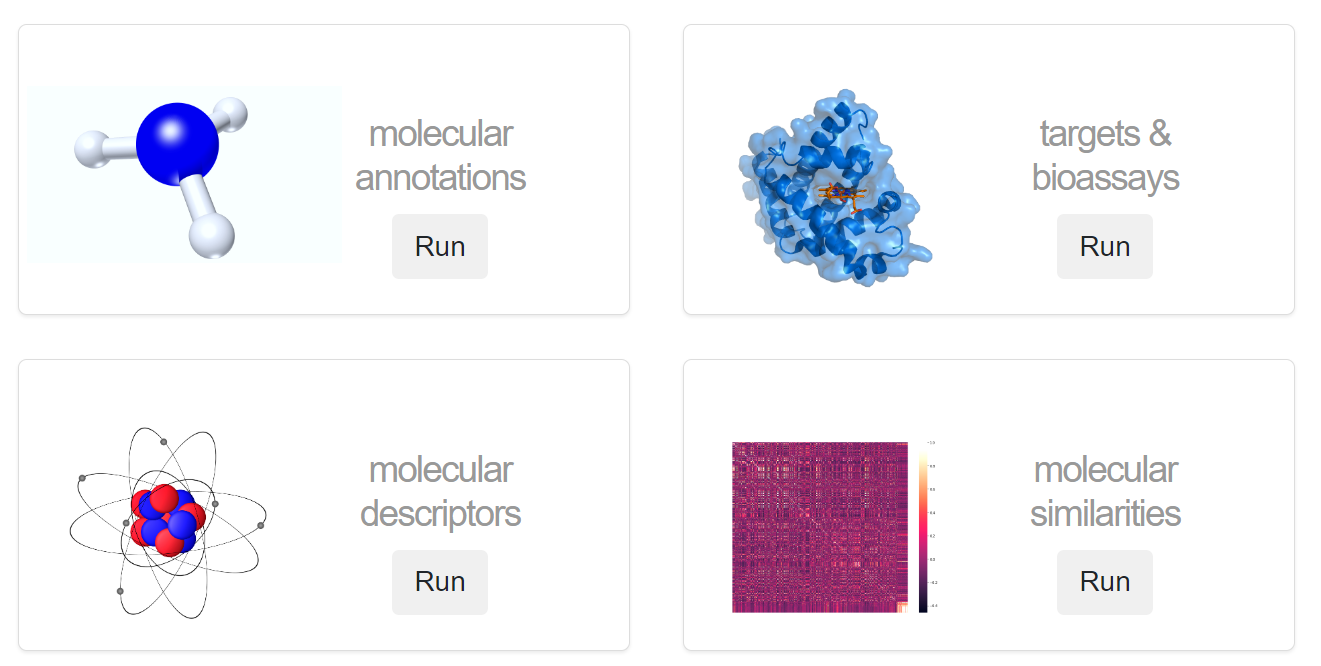
Through the Home section, users can browse molecules, targets and bioassays, descriptors, and similarities by clicking on the corresponding "Run" button.
The molecular annotation card leads to the list of molecules. Molecules are specified by the following identifiers:
- Chemical Name
- CID
- CAS
- InChIKey
- Canonical SMILES
- Molecular Formula

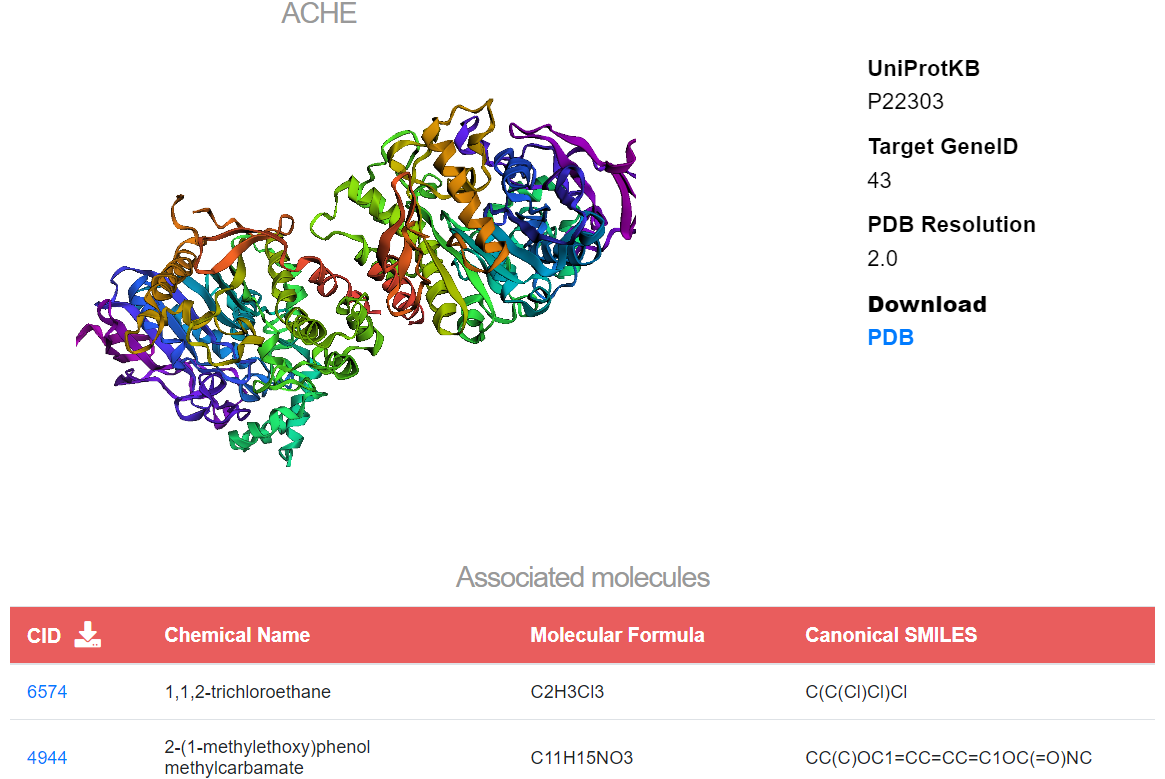
The targets & bioassays card leads to the list of biossays. Bioassays are specified through the assay ID (AID), associated CID, activity value in µm, activity name, assay name, assay type, and PubMed ID. Targets are inserted by their:
- GenInfo Identifier (GI)
- Gene ID
- Symbol
- UniProtKB

In the selected target panel, users can visualize the optimized PDB structure generated with 3Dmol.js and download the file via the “PDB” button. If the PDB structure is not available, users can download and explore the predicted protein structure on the AlphaFold page. Molecules associated with the searched target can be downloaded as a CSV file by pressing on the download icon in the table header. By clicking on a CID entry, users are redirected to the similar molecules panel.
Fingerprints are illustrated through an interactive radar chart representing the distribution of the inverse-document-frequency weights, while molecular descriptors and quantum properties are illustrated through a scatter plot matrix. By pressing on the download icon, users can obtain a CSV file with the desired descriptor table.

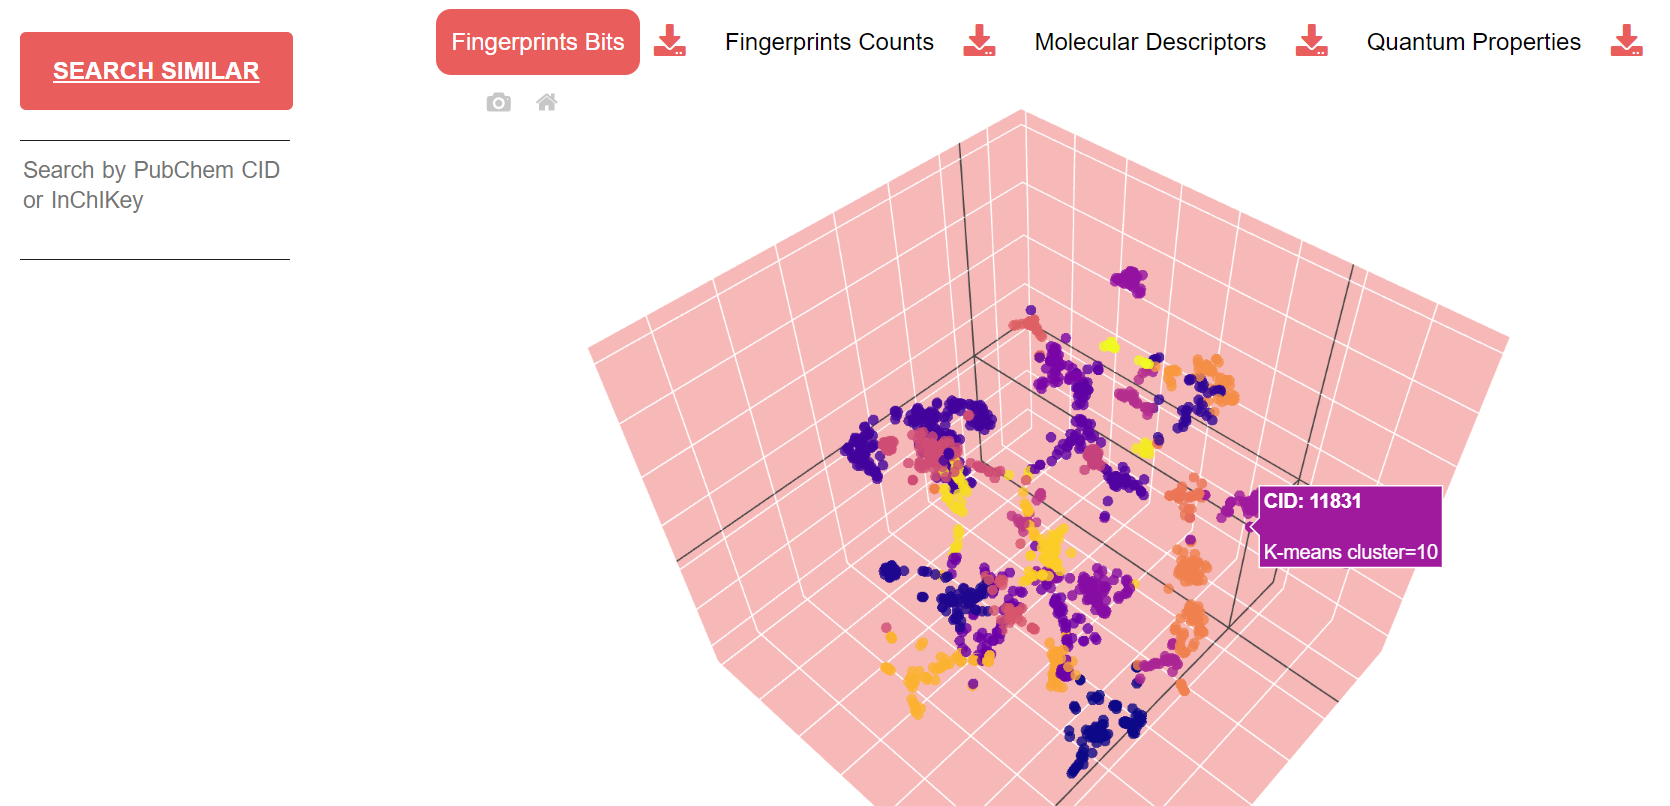
Similarity spaces are illustrated through an interactive scatter plot of k-means clusters projected to 3D with t-SNE. A legend shows for each cluster the number of similar molecules found. By pressing on the download icon, users can obtain a .zip file with the corresponding embedding model from Node2Vec (note that molecular descriptors and quantum properties also include the model for single elements). Similar molecules can be retrieved by inserting the CID or InChIKey of a molecule of interest in the search area.
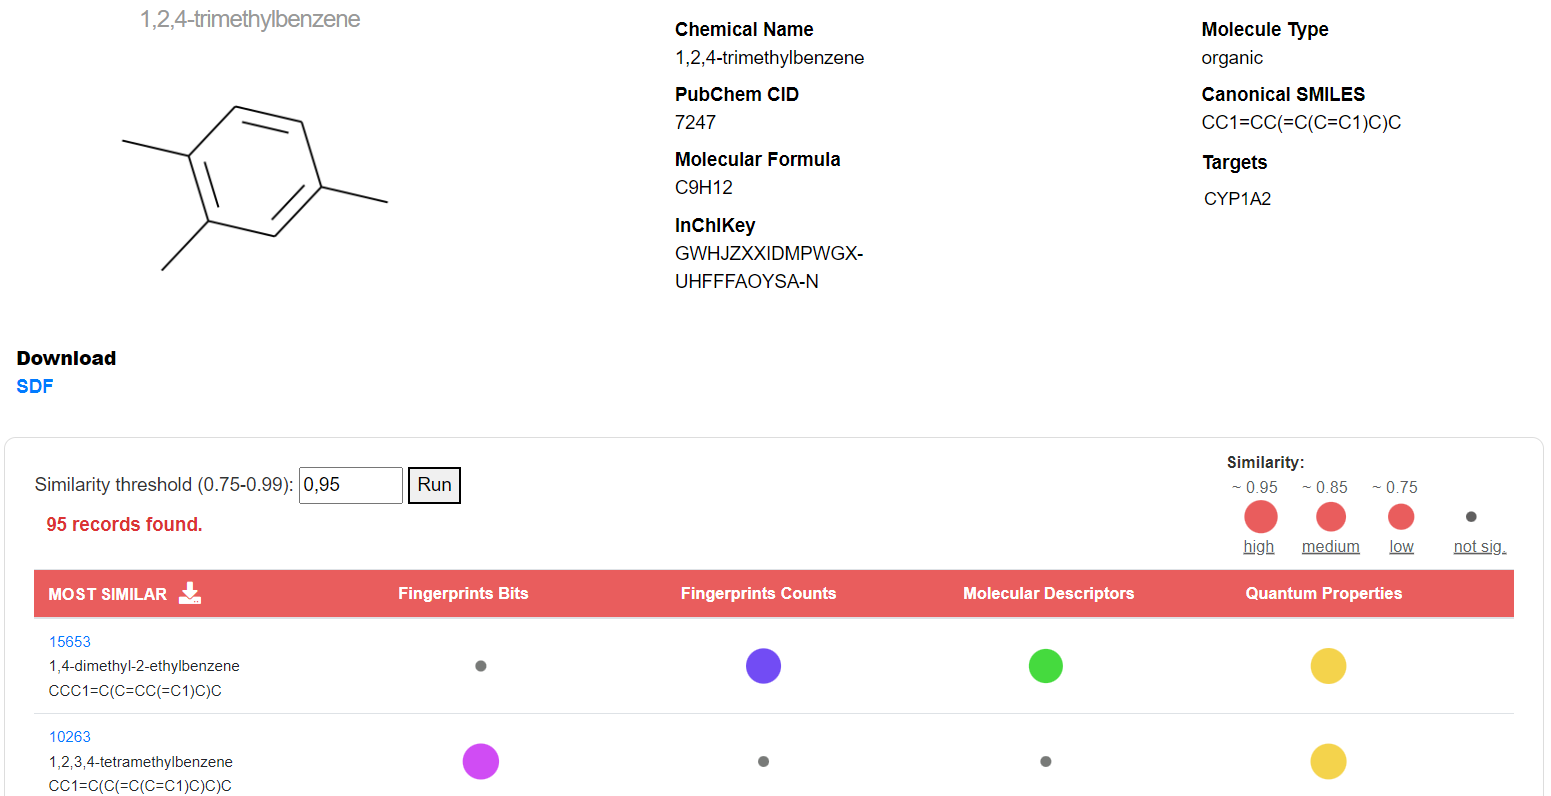
The similarity panel of a query molecule shows molecular info together with the 2D structure generated with RDKit and the list of similar molecules ranked by the number of intersecting chemical spaces (indicated with different colours) and the average similarity computed across spaces. Users can change the similarity threshold in the range of 0.75-0.99 (default is 0.95); if no similar molecules are found, those with the closest threshold are returned. The “SDF” button allows downloading the optimized SDF file for the searched molecule. Similar molecules can be downloaded as a CSV file by pressing on the download icon in the table header.
License
Copyright (c) 2023 by Eva Viesi | InfOmics
Except where otherwise noted, this website and all its content is licensed under a MIT License.